In the following example (located in $OIVHOME/src/MeshViz/Mentor), we will use a 2D Cartesian mesh, do a solid contouring on it, and add a legend to it. Notice the following steps:
Mesh initialization from a file
Definition of the color mapping
Definition of an isovalue list
Creation of the legend node (in a default view, the SoCamera SoCamera SoCamera node is after it in the scene graph, so the legend will not be affected by camera manipulations you can do through the plane viewer).
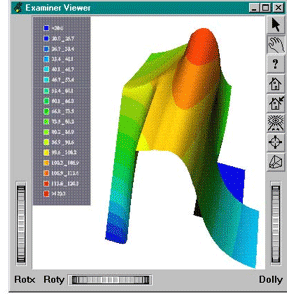
Creation of contouring node, setting the valuesIndex field and the zValuesIndex field to achieve a “3D” visualization.
Example 2.46. A 2D Cartesian mesh and its legend
// tutorialMesh03.cxx
...
  void
  read_mesh(int *nx, float *&x, int *ny, float *&y)
  {
  FILE *f;
    int i,j,n;
    float c;

    f = fopen ("mesh2D.geo", "r");
    if (f == NULL) exit(-1);
    fscanf (f, "%d%d", nx, ny);
    x = (float *)malloc(*nx * *ny * sizeof(float));
    y = (float *)malloc(*nx * *ny * sizeof(float));
    for (i = 0, n = 0; i < *nx; i++)
    {
    fscanf(f,"%f",&c);
      for (j = 0; j < *ny; j++,n++) x[n] = c;
    }
  for (j= 0; j < *ny; j++)
    {
    n = j;
      fscanf(f,"%f",&c);
      for (i = 0; i < *nx; i++, n += *ny) y[n] = c;
    }
  }

void
    read_val(int nv, float **val, float *vmin, float *vmax)
    {
    FILE *f;
      float c;

      f = fopen("mesh2D.dat", "r");
      if (f == NULL) exit(-1);

      *vmin=1E30;
      *vmax=-1E30;
      float *v = (float *)malloc(nv * sizeof(float));
      for (int i = 0; i < nv; i++)
      {
      fscanf(f,"%f",&c);
        v[i] = c;
        if (*vmin > c) *vmin = c;
        if (*vmax < c) *vmax = c;
      }

    *val = v;
    }

 int
   main(int, char **argv)
   {
   // Initialize Inventor and Xt
     Widget myWindow = SoXt::init(argv[0]);
     if (myWindow == NULL) exit(1);

   // Initialize the new nodes class
     PoMeshViz::init();

   // Read back from file mesh data and geometry
     int numX,numY;
     float *xm,*ym,*vm,vmin,vmax;
     read_mesh(&numX, xm, &numY, ym);
     read_val(numX*numY, &vm, &vmin, &vmax);

   // Define data mapping
     SbColor colors[5] =
     {
     SbColor(0,0,1), SbColor(0,1,1), SbColor(0,1,0),
       SbColor(1,1,0), SbColor(1,0,0)
     };
   float val[5];
     val[0] = vmin;
     for (int i=1; i<5; i++) val[i] = val[i-1]+(vmax-vmin)/4.;
     PoNonLinearDataMapping2 *myDataMapping = New PoNonLinearDataMapping2;
     myDataMapping->type = PoNonLinearDataMapping2::LINEAR_PER_LEVEL;
     myDataMapping->value.setValues(0,5,val);
     myDataMapping->color.setValues(0,5,colors);

   // Define the list of isovalues
     PoIsovaluesList *myIsovaluesList = new PoIsovaluesList;

   // Initialize the mesh
     myIsovaluesList->setRegularIsoList(vmin,vmax,16);
     PoCartesianGrid2D *mesh = new PoCartesianGrid2D;
     mesh->setGeometry(numX, numY, xm, ym);
     mesh->addvalueSet(0,vm);

   // Create legend node
     PoNonLinearValueLegend1 *myLegend =
       new PoNonLinearValueLegend1(SbVec2f(-1,1), SbVec2f(-.5,-.5));
     myLegend->set("backgroundApp.material", "diffuseColor .4 .4 .4");
     SoAnnotation *legendAnnot = new SoAnnotation;
     legendAnnot->addChild(myLegend);
   // Create the solid contour visualization node.
     PoMeshFilled *myfill = new PoMeshFilled;
     myFill->valuesIndex.setValue(0);
     myFill->zValuesIndex.setValue(0);
     myFill->coloringType = PoMesh::COLOR_CONTOURING;

     SoPerspectiveCamera *myCamera = new SoPerspectiveCamera;

   // Create the root of our scene graph
     SoSeparator *root = new SoSeparator;
     root->ref();
     root->addChild(mesh);
     root->addChild(myIsovaluesList);
     root->addChild(myDataMapping);
     root->addChild(legendAnnot);
     root->addChild(myCamera);
     root->addChild(myFill);

     SoXtExaminerViewer *viewer = new SoXtExaminerViewer(myWindow);
     viewer->setSceneGraph(root);
     viewer->setBackgroundColor(SbColor(1.,1.,1.));
     viewer->show();

     SoXt::show(myWindow);
     SoXt::mainLoop();
     return 0;
    }